Study for Statistics Test Level 2 (3)

previous page
Today's study is about 'dealing with qualitative data' and 'statistics and summary of double variable data'.
Dealing with qualitative data
The method of visualizing qualitative data is either a bar graph or a pie chart. If you use an ordinal scale, you should arrange data from smallest to largest.
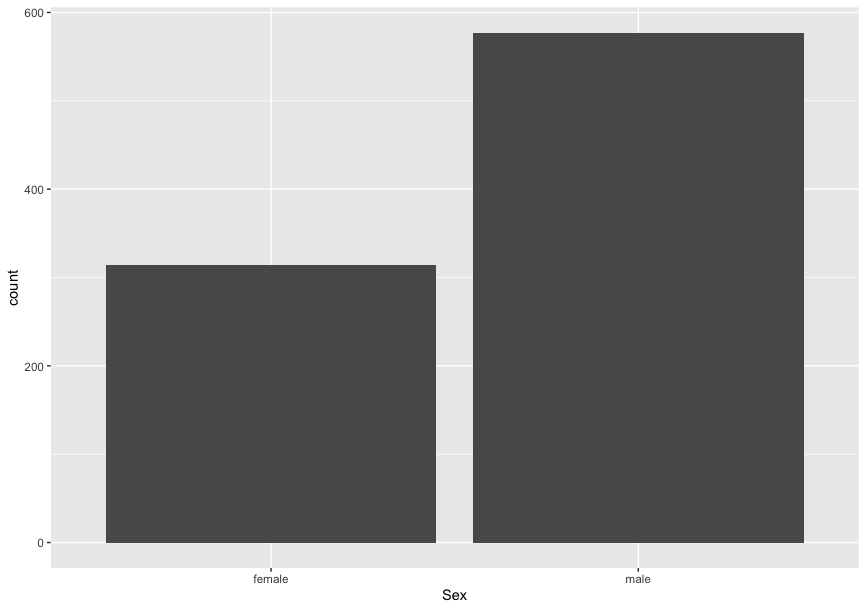
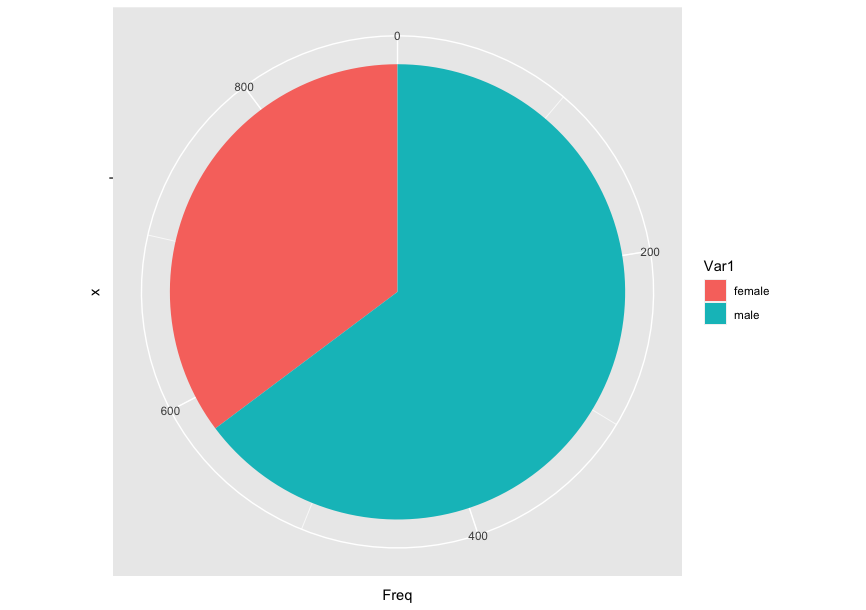
There's a bar graph using the Titanic ML from the disaster and a pie chart using the same dataset.
Statistics and summary of double variable data
Scatter diagram
Scatter plots are helpful to confirm correlation. The more one variable increases, the more the other increases in a positive correlation. Conversely, the more one variable increases, the more the other decreases in a negative correlation. With neither of these correlations, it is termed as no correlation. Correlation has strength.
Cross table
If you have a lot of data, you can separate the quantity variable into several classes. Cross tables display the frequency in these classes. Marginal frequencies are counted in every class for each variable.
Correlation coefficient
Covariance
$$ \text{Covariance} = \frac{\sum{(X_i - \bar{X})(Y_i - \bar{Y})}}{n} $$
The formula for the Pearson correlation coefficient divides covariance by SD:
\( r = \frac{n(\sum xy) - (\sum x)(\sum y)}{\sqrt{[n\sum x^2 - (\sum x)^2][n\sum y^2 - (\sum y)^2]}} \)
If these values are positive, there's a positive correlation. If negative, there's a negative correlation. The correlation coefficient ranges between -1 and 1. It also represents the covariance of the z-score.
*Attention
Correlation does not imply causation. When there's correlation but not causation, the correlation is termed 'spurious correlation'. For instance, a third value can affect the correlation coefficient. The correlation coefficient indicates only a linear relation, not a non-linear relation.
Partial correlation
When a third value affects the correlation coefficient, it's necessary to remove the effect of the third value for precise correlation, termed 'partial correlation'. The formula for the partial correlation coefficient between variables X and Y, controlling for variable Z, is:
\( r_{XY.Z} = \frac{r_{XY} - r_{XZ} r_{YZ}}{\sqrt{(1 - r_{XZ}^2)(1 - r_{YZ}^2)}} \)
Where:
- \( r_{XY} \) is the correlation coefficient between \(X\) and \(Y\).
- \( r_{XZ} \) is the correlation coefficient between \(X\) and \(Z\).
- \( r_{YZ} \) is the correlation coefficient between \(Y\) and \(Z\).
Regression line
The regression line is used to predict Y from X. X is defined as the explanatory variable, and Y is defined as the response variable. Consider the relationship as "Y = α+βx". This line is termed the "Regression line", and α and β are known as "regression coefficients".
The formula for the Error Sum of Squares (ESS) is:
\( \sum_{i=1}^{n} (y_i - \hat{y}_i)^2 \)
Where:
- \( y_i \) is the actual observed value.
- \( \hat{y}_i \) is the predicted value from the model.
- \( n \) is the number of data points.
\( y_i - \hat{y}_i \) is termed "residual".
The Least Squares Method seeks the regression coefficient when ESS is at its minimum.
On the regression line, there are several key features:
- The mean of the predicted value equals the mean of the response variable.
- The mean of the residual is zero.
- The regression line passes through (\( \bar{x}, \bar{y} \)).
- The correlation coefficient between prediction and residual is zero.
- The Total Sum of Squares breaks down into Regression Sum of Squares and Residual Sum of Squares.
- Dividing the Regression Sum of Squares by the Residual Sum of Squares is termed the "coefficient of determination (\( R^2 \))". \( R^2 \) ranges from zero to one. When \( R^2 \) is one, the regression line fully explains the actual observed value.
Today's study has finished.
…英語難しい。。。