Study for Statistics Test Level 2 (2)

previous page
I've forgotten to translate the title into English.
Today's study is about 'Indicators of Distribution'.
Using Indicators of Distribution is a method of showing the features of a distribution.
- Mean
- Variance & Standard Deviation
- Coefficient of Variation (CV)
- Median & Mode
- Range & Interquartile Range (IQR)
- Five-number Summary & Box and Whisker Plot
Mean
The mean is the center of gravity and almost the center of data in a close to normal distribution, but the more different from a normal distribution, the less meaning of the center.
Variance & Standard Deviation
Variance shows how far the value is from the mean.
The standard deviation (SD) is the square root of the variance.
SD is the same unit as the base value.
Variance and SD are indications of the scattering of data.
*z score
The z score shows the difference between particular data and the mean.
Coefficient of Variation (CV)
If you want to compare two data sets that have much different means, SD is wasteful, and CV is useful.
CV is standardized SD by the mean.
Median & Mode
If the data is asymmetrical, the mean doesn't indicate the features of the data.
In this case, you should use the median or mode instead.
The median is the center value when the values are lined up from low to high.
The mode is the most frequent value in the data.
Using the mode requires the data to have one peak.
Range & Interquartile Range (IQR)
The range is the difference between the max value and the min value.
When the values are lined up from low to high, the points of 25%, 50%, and 75% of the data are named the First Quartile, Second Quartile, and Third Quartile, respectively.
IQR is defined as the following
and half of the IQR is called 'quartile deviation'.
Five-number Summary & Box and Whisker Plot
The five-number summary includes the minimum, Q1, median, Q3, and maximum.
The box and whisker plot visualize these numbers.
You can limit the whisker range within 1.5 * IQR, and the values out of range are defined as outliers. That way, evaluate outliers more accurately.
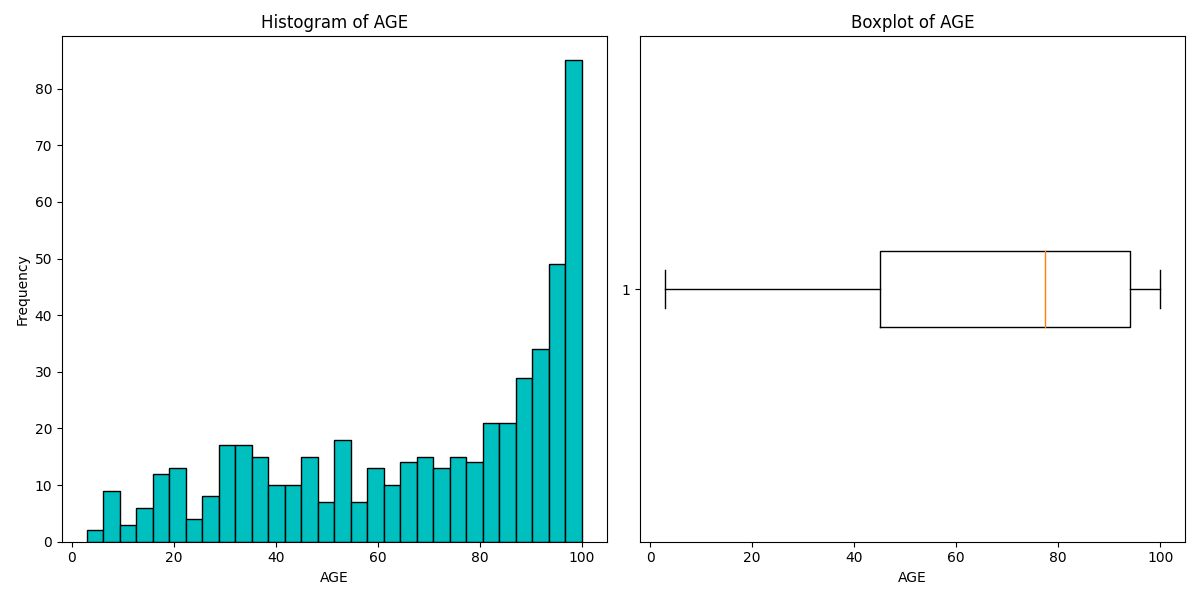
Histogram and Box and Whisker Plot using the Boston Housing Dataset
Today's study is finished.
Next time, I'm going to study dealing with qualitative data.